

Introduction
In part one of this multi-part blog series, we covered how to establish a Microsoft Operations Management Suite environment; in the second part, Part II, we will discuss how to get started with Microsoft Operations Management Suite and we will introduce OMS solutions. If you missed Part I, please make sure to check it here before you move on to Part II.
In this post, you will become familiar with the OMS console. You will learn how to configure OMS to collect data through integration with System Center Operations Manager (SCOM) and through direct connections to individual servers. In addition, you will learn how to customize your OMS dashboard.
OMS Solutions are a collection of logic, visualization, and data acquisition rules that can help you investigate and resolve issues, collect data, and be proactive with important planning and security activities.
In this post, you will learn also how Microsoft Operations Management Suite uses Solutions to deliver insights into your log data by providing a cost-effective, all-in-one cloud management solution so you can better protect guest workloads in Azure, AWS, Windows Server, Linux, VMWare, and Open Stack.
Infrastructure Overview
We have the following servers installed in our demo environment:
- Domain controller, DNS, WSUS;
- System Center Operations Manager 2012 R2 with update Rollup 9;
- SQL Server holding SCOM databases;
- Linux Server (Ubuntu).
Getting Started with Microsoft Operations Management Suite
Step 1 – Configure OMS Settings
In this step, you will use the OMS Settings tile which allows you to configure Solutions, Logs, and Accounts.
- Launch Operations Management Suite Portal at http://www.microsoft.com/en-us/server-cloud/operations-management-suite/overview.aspx
- Click Sign in, enter the credentials associated with OMS, and click Sign in
- Click the OMS Workspace name. The OMS Portal will open (you may be asked to confirm your email address).
- Switch to the Operations Management Suite Portal.
- On the Overview blade, scroll to the right and click the Settings
- Ensure all available solutions are selected and click Add Selected Solutions as shown in the following screenshot:
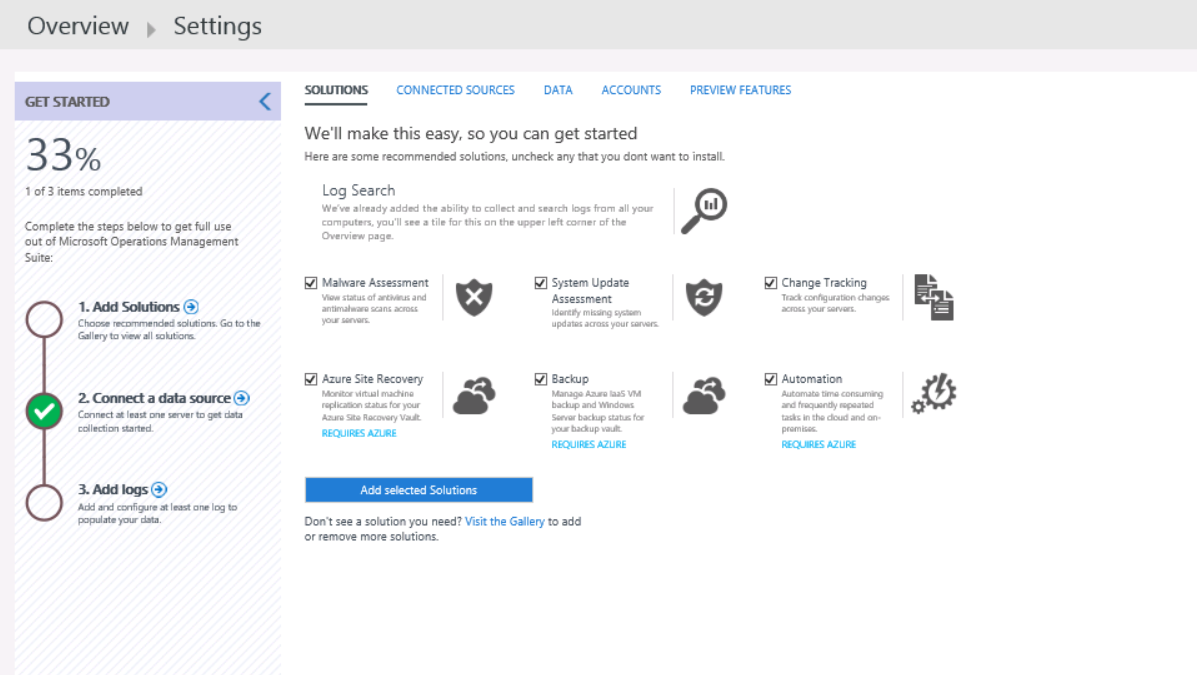
Basic solutions are added to the console: Log Search, Automation, Azure Site Recovery, Backup, Change Tracking, Malware Assessment, and System Update Assessment.
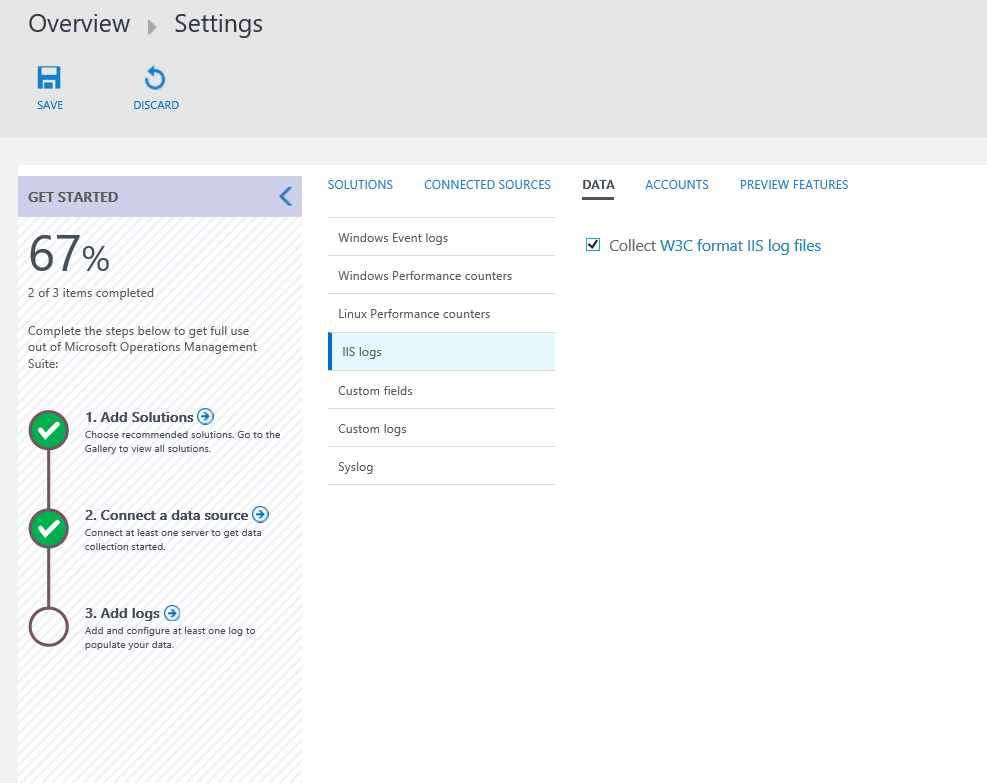
- On the Settings page, click Add LOGS.
- Select IIS Logs.
- Select the check box next to Collect W3C format IIS log files as shown in the following screenshot:
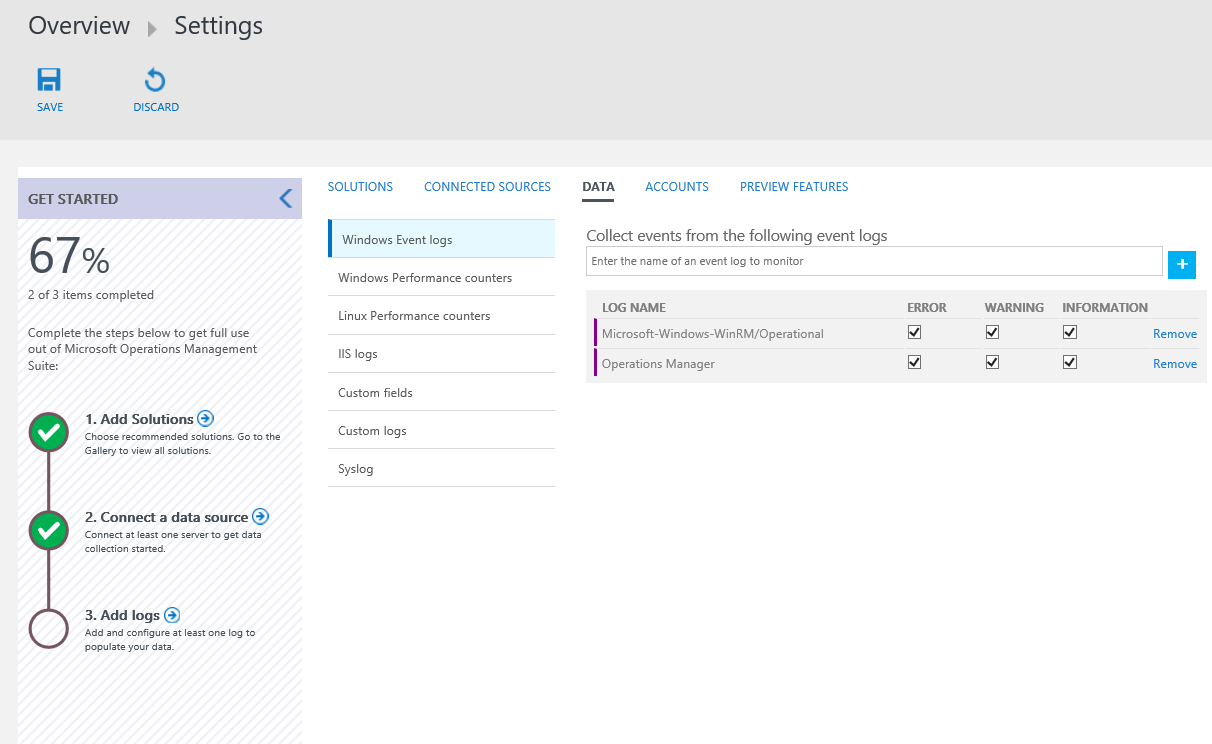
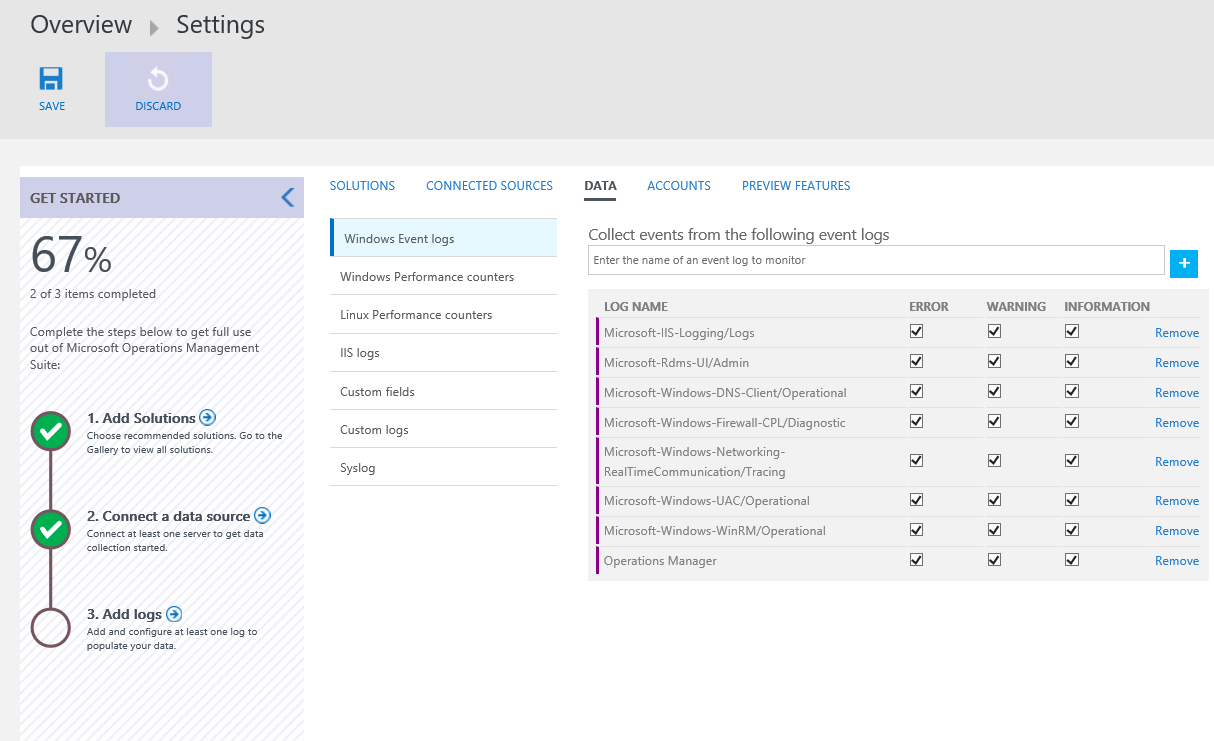
- Under Windows Event Logs, click Enter the name of an event log to monitor.
- Type Microsoft-Windows-WinRM/Operational and click the plus sign.
- Select the check boxes next to ERROR, WARNING, and INFORMATION as shown in the following screenshot:

- Click Enter the name of an event log to monitor, type Operations, select Operations Manager, and click the plus sign.
- Select the check boxes next to ERROR, WARNING, and INFORMATION as shown in the following screenshot:
- Click Enter the name of an event log to monitor, type Microsoft-, select another log, and click the plus sign.
- Select the check boxes next to ERROR, WARNING, and INFORMATION as shown in the following screenshot:
- Add several more logs and configure the levels to be collected.
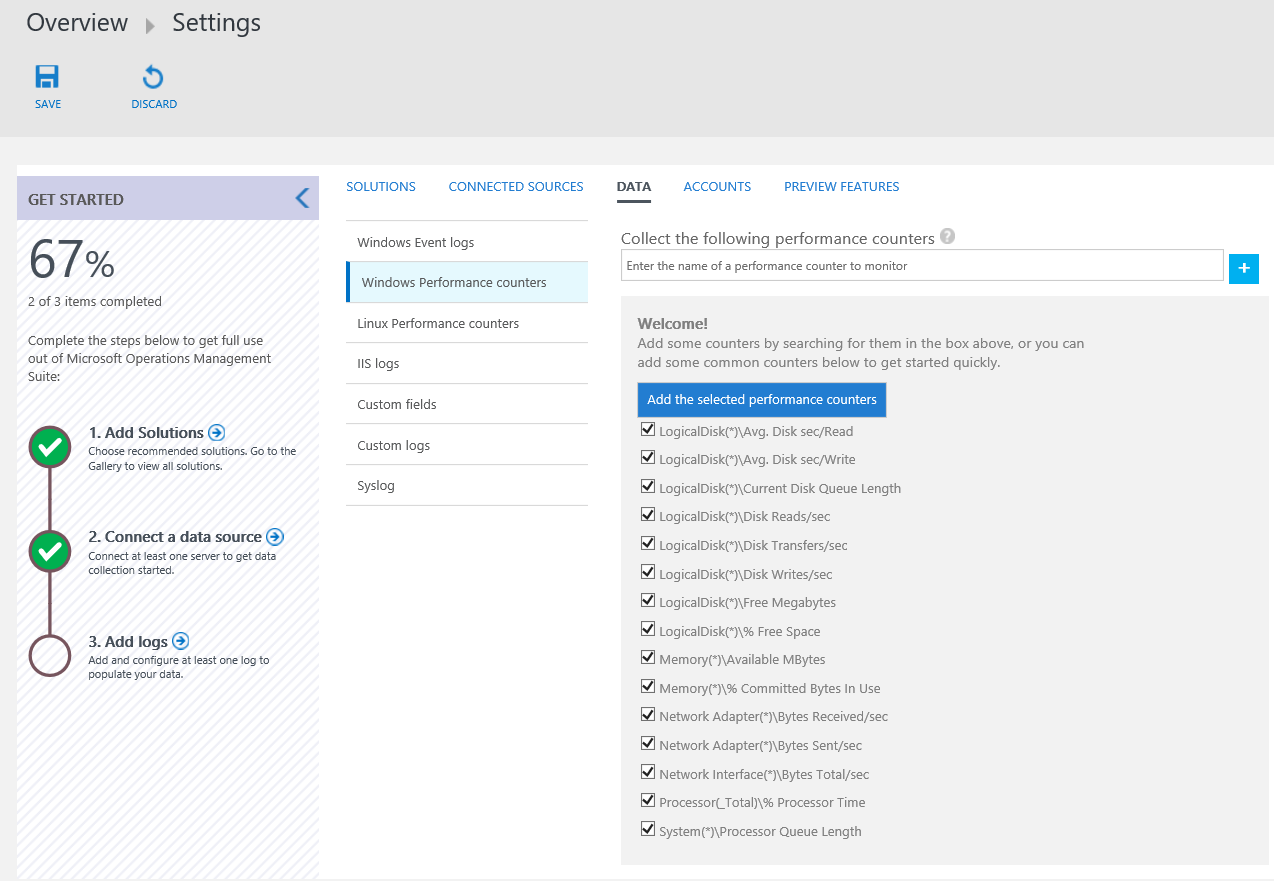
- Under Windows Performance Counters, review the available counters and click Add the selected performance counters as shown in the following screenshot:
- Click SAVE.
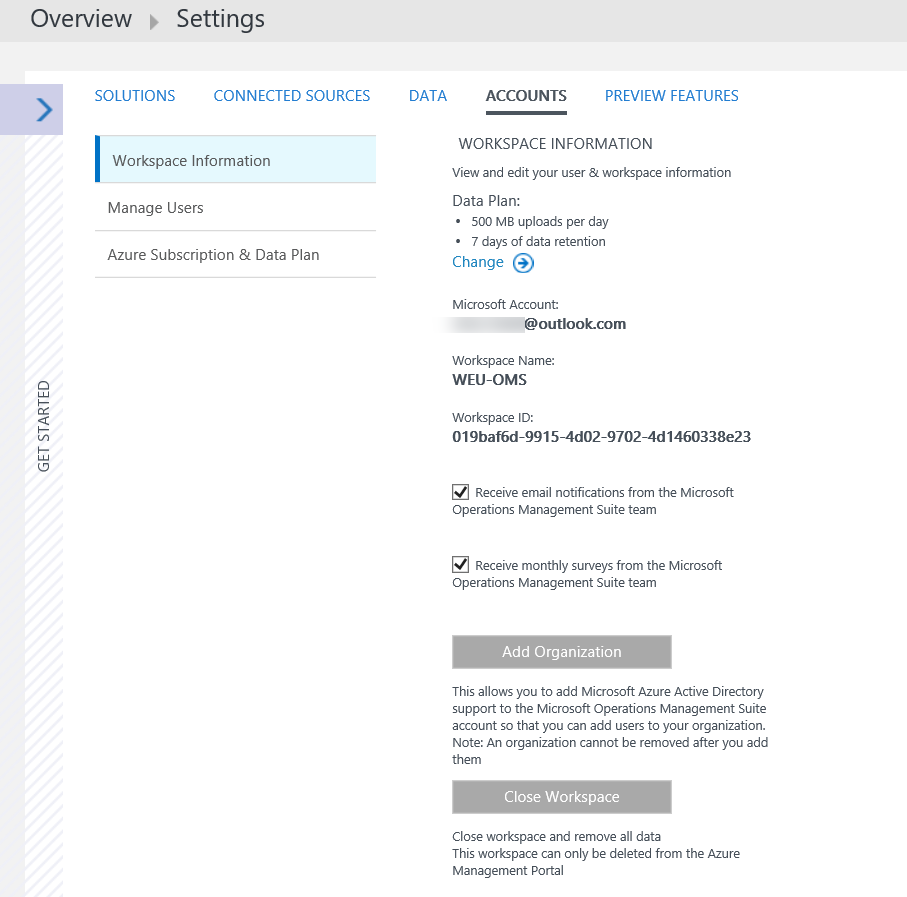
- On the Settings blade, click ACCOUNTS as shown in the following screenshot (this page provides the ability to configure your workspace(s) and manage OMS user accounts):
Step 2 – Configure Domain Controller as a Connected Source via a Direct Agent
In this step, you will use the OMS Settings tile to configure your domain controller as a Connected Source via a direct connection.
- Launch Operations Management Suite Portal at http://www.microsoft.com/en-us/server-cloud/operations-management-suite/overview.aspx
- Click Sign in.
- Enter the credentials associated with OMS, and click Sign in
- Click the OMS Workspace name.
- On the dashboard, scroll to the right and click the Settings
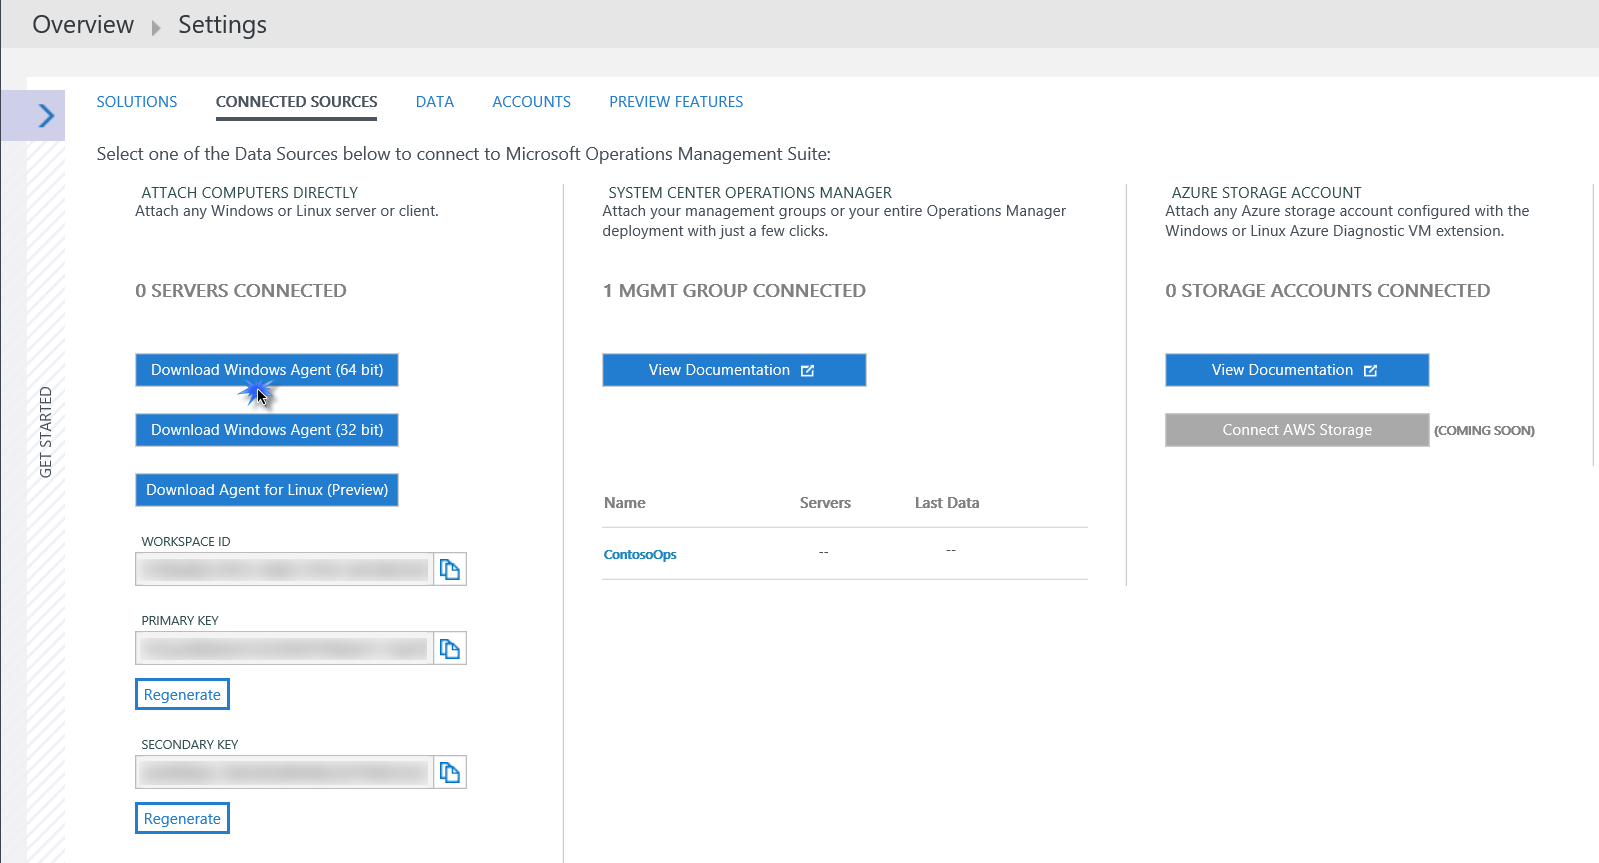
- On the Settings blade, click CONNECTED SOURCES.
You have three options for connecting your server environment to OMS: you can attach any Windows server or client directly, attach your management groups or your entire Operations Manager Deployment, or attach any Azure storage account configured with the Windows or Linux Azure Diagnostic VM extension.
- Under ATTACH COMPUTERS DIRECTLY, click Download Windows Agent (64 bit) as shown in the following screenshot.
- Make sure you copy the MMASetup-AMD64.exe over your domain controller and Click to Run.
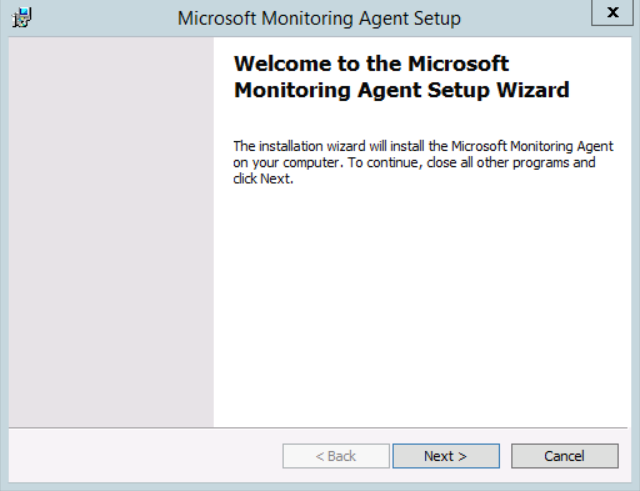
- In the Microsoft Monitoring Agent Setup Wizard, click Next.
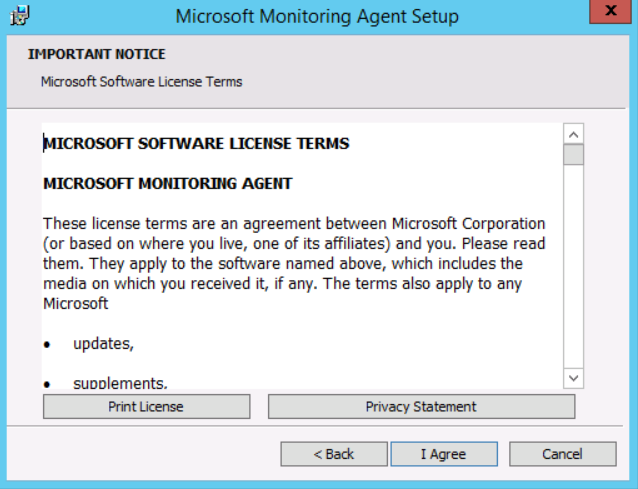
- Click I Agree.
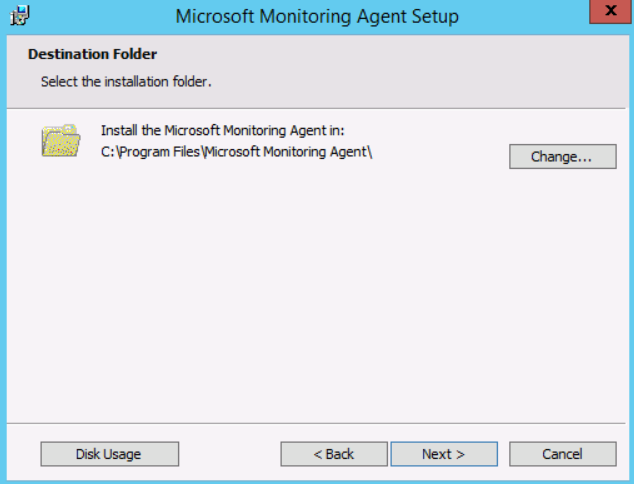
- On the Destination Folder page, click Next.
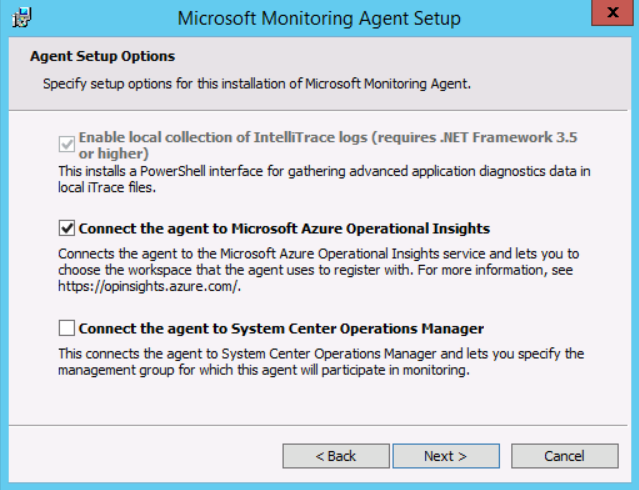
- Click the checkbox next to Connect the agent to Microsoft Azure Operational Insights and click Next.
- Switch to the OMS Settings blade, click the Copy icon next to WORKSPACE ID, and click Allow access.
- Switch to the Microsoft Monitoring Agent Setup Wizard, click in the Workspace ID field in the Wizard, and press CTRL-V.
- Switch to the OMS Settings blade, click the Copy icon next to PRIMARY KEY, and click Yes.
- Switch to the Microsoft Monitoring Agent Setup Wizard, click in the Workspace Key field in the Wizard, and press CTRL-V.
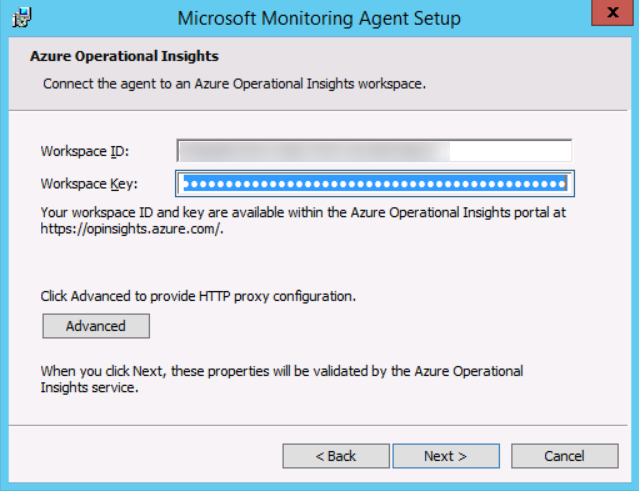
- Click Next.
- Click Install.
- Click Finish.
- Right-click Start and click Control Panel.
- Click Microsoft Monitoring Agent.
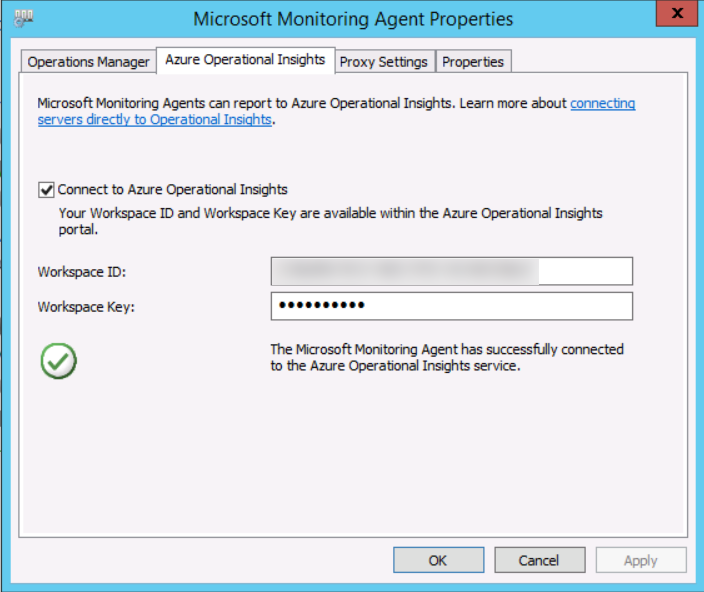
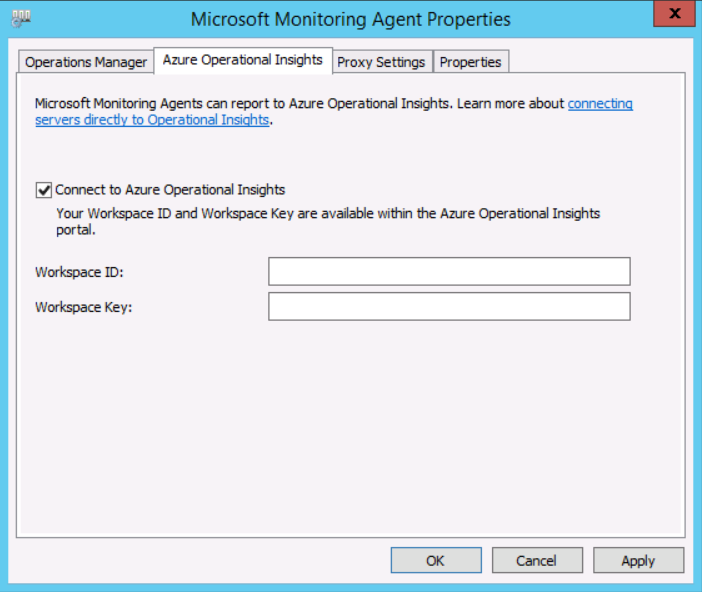
- Click the Azure Operational Insights
Note that the Connect to Azure Operational Insights checkbox is selected and the Workspace ID and Workspace Key are configured, per the earlier steps in OMS.
- Click Cancel.
Step 3 – Configure SQL Server as a Direct Connection Connected Source
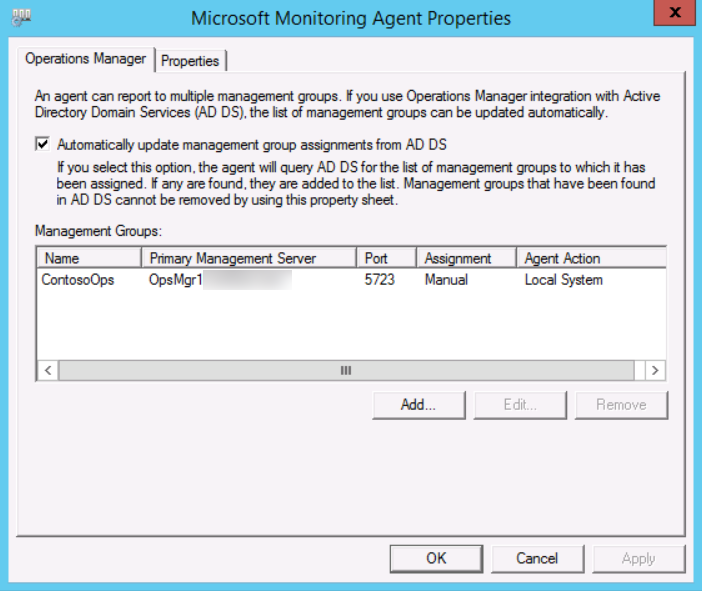
It is possible to configure a machine to report to both OMS and SCOM at the same time. If you recall, in Part I, we are monitoring the SQL server using SCOM on-premises, so it is already reporting to SCOM.
In this step, you will use the OMS Settings tile to configure SQL Server as a Connected Source via a direct connection.
- Login into your SQL Server.
- Click Start and click Control Panel.
- Click Microsoft Monitoring Agent, as you can see in the following screenshot that the agent is configured to send data to SCOM.
The following steps are similar to the steps described in the previous section.
- Switch to Operations Management Suite Portal at http://www.microsoft.com/en-us/server-cloud/operations-management-suite/overview.aspx
- On the Settings blade, click CONNECTED SOURCES.
- Under ATTACH COMPUTERS DIRECTLY, click Download Windows Agent (64 bit).
- Click RUN on MMASetup-AMD64.exe
- In the Microsoft Monitoring Agent Setup Wizard, click Next.
- Click I Agree (because the agent is already deployed on the machine, you must upgrade it to add OMS direct connection capabilities).
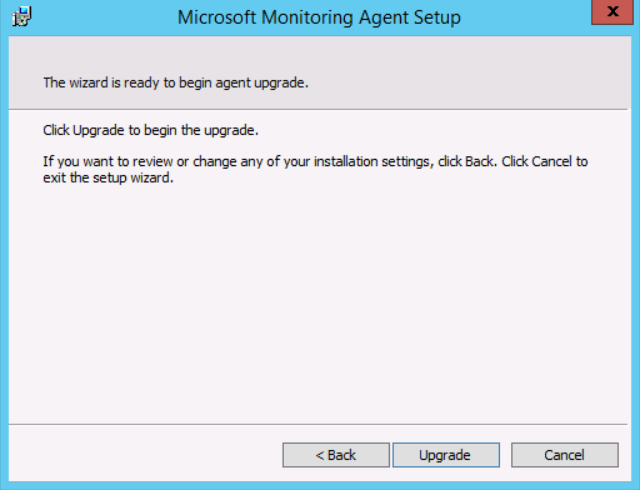
- Click Upgrade.
- Click Finish.
- Click Yes to restart the computer.
- After the reboot is completed, log on again to your SQL Server.
- Click Start, click Control Panel, and click Microsoft Monitoring Agent.
- Click on the Azure Operational Insights
- Click the checkbox next to Connect to Azure Operational Insights.
- Leave the agent configuration window open.
- Open Internet Explorer and sign in using your OMS account credentials.
- Click Settings and click on Connected Sources.
- Click the Copy icon next to WORKSPACE ID and click Allow access.
- Switch to the Microsoft Monitoring Agent properties, click in the Workspace ID field and press CTRL-V.
- Switch to the OMS Settings blade again, click the Copy icon next to PRIMARY KEY.
- Switch to the Microsoft Monitoring Agent properties, click in the Workspace Key field and press CTRL-V.
- Click OK (the agent will stop and start automatically).
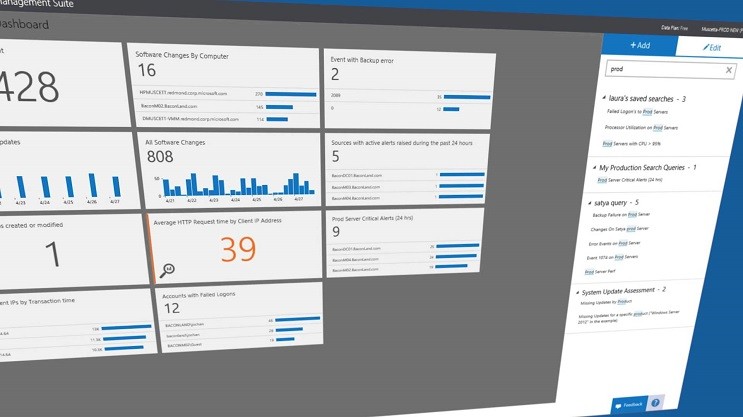
Step 4 – Customize the OMS Dashboard
In this step, we will customize the OMS My Dashboard tile.
- Open Operations Management Suite Portal at http://www.microsoft.com/en-us/server-cloud/operations-management-suite/overview.aspx
- In the OMS Portal, to the left of Overview | Settings, click the Overview icon.
- Click My Dashboard
- Click CUSTOMIZE (by customizing your dashboard, you can quickly visualize the data sets that are most important to you and gain valuable insight into your datacenter).
- From the menu on the right, under Change Tracking, select All Configuration Changes and drag it onto My Dashboard.
- Under System Update Assessment on the right hand side, select All computers with missing or Security Updates and drag it onto My Dashboard.
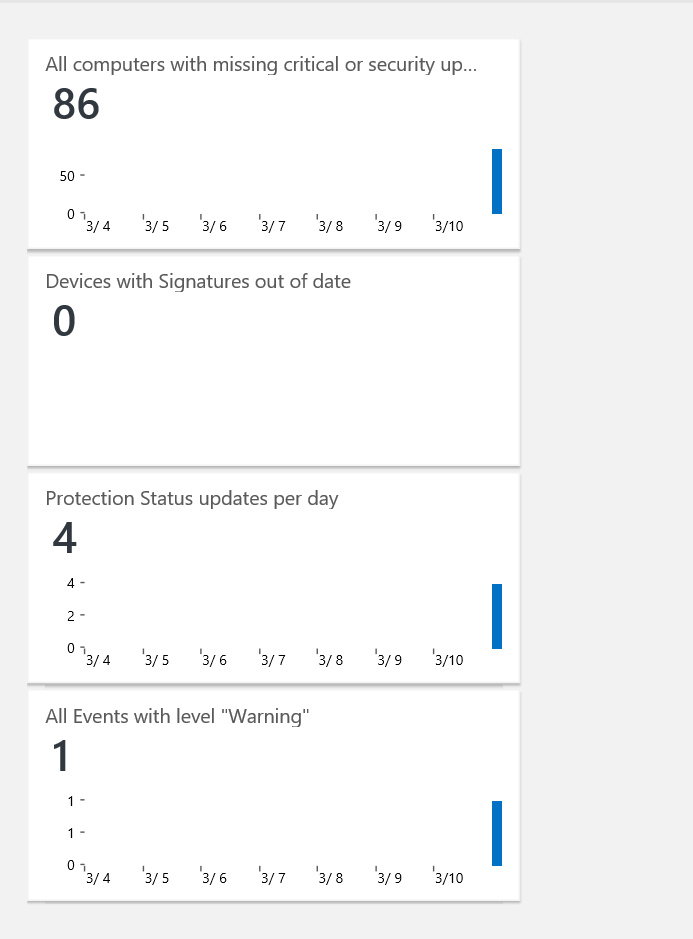
- Drag several additional items to My Dashboard as shown in the following screenshot:
Step 5 – Added Microsoft Operations Management Suite Solutions to the OMS Console
In this step, you will explore several tiles on the OMS dashboard that can assist you in gaining deeper insight into your environment such as Security and Audit, SQL Assessment, and Automation.
- Open Operations Management Suite Portal at http://www.microsoft.com/en-us/server-cloud/operations-management-suite/overview.aspx
- In OMS portal, click the Overview icon.
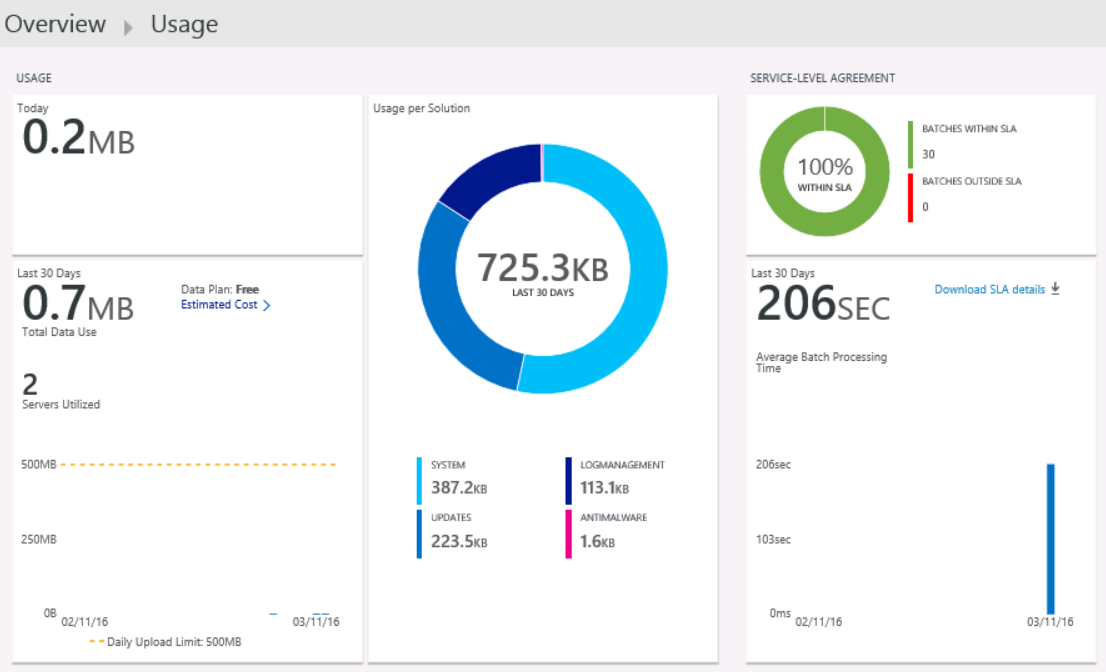
- Click the Usage Review the type of data revealed in the tile.
- Click the Overview icon.
- Click the Solutions Gallery
- Click AD Assessment.
- Click Add (there will not yet be data populating the solution, it can take up to 4 hours for recommendations to appear).

The AD Assessment tile is now added to the dashboard
- Click Solutions Gallery.
- Click SQL Assessment and click
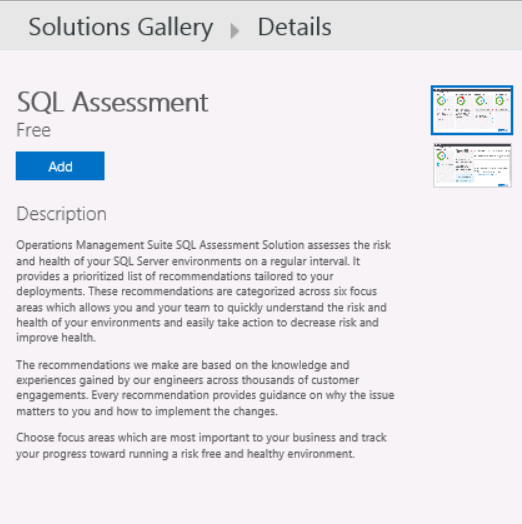
The SQL Assessment tile is now added to the dashboard
- Click the Overview icon.
- Click the Solutions Gallery
- Click Security and Audit and click Add.
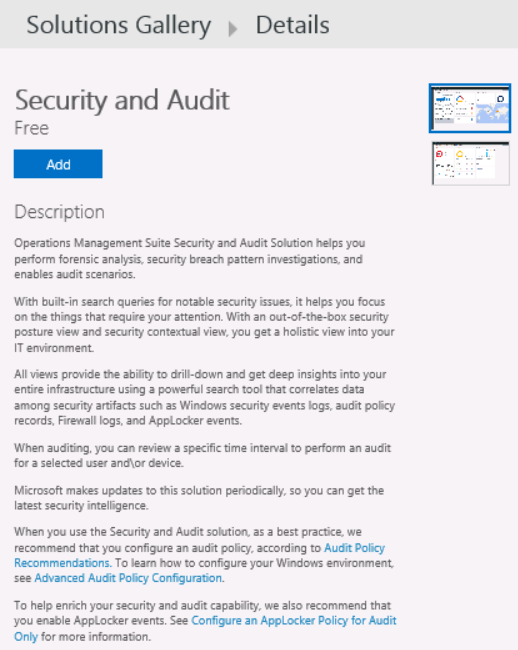
The Security and Audit tile is now added to the dashboard
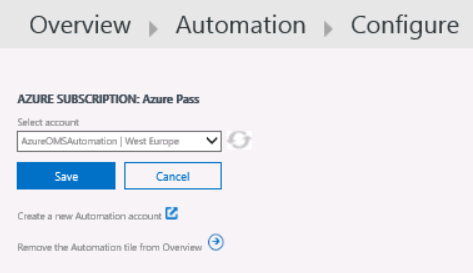
- Click the Overview icon.
- Click the Automation
- Ensure your Azure Pass is listed as the account and click Save.
- Click the Overview
- Click the Solutions Gallery
- Click Alert Management and click Add.
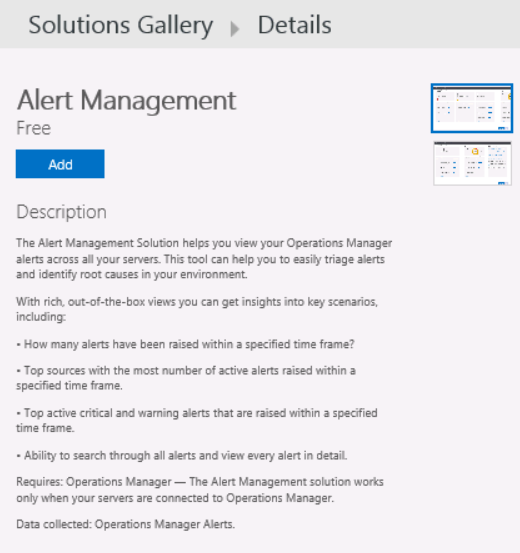
The Alert Management tile is now added to the dashboard
- Click the Overview
- You will see the solutions that we just added them in this section (you can move the blade to the right hand side to view the complete OMS solutions).

Note: The amount of time it takes to populate data to a solution tile varies based on the specific solution. For example, an initial AD Assessment can take up to 4 hours before the OMS dashboard is populated with data; thereafter, AD Assessment data is collected twice per day and updated to OMS.
Congratulations! In Part 2 we covered how to get started with Microsoft Operations Management Suite Environment, and we introduced OMS solutions by completing the following steps:
- Configured OMS Settings;
- Configured Domain Controller as a Connected Source via a Direct Agent;
- Configured SQL Server as a Direct Connection Connected Source;
- Customized the OMS Dashboard;
- Added Microsoft Operations Management Suite Solutions to the OMS Console.
Until then… see you in Part 3.
Thanks for reading.